Stock Market Update, Friday July 25, 2025: Summer Stall or Squall
[embedyt] https://www.youtube.com/watch?v=dZg7dM0l-Vk[/embedyt]
It’s been an incredible 3.5 months, V-bottom rally in stocks since peak market fears over the economic uncertainty caused Liberation Day tariff spreadsheet chaos. The administration has walked back some of the most draconian tariff levels touted by Peter Navaro even seeming to play nicer a bit with China on many points.
The investment team at OHFG discussed the likely V-bottom in stocks since mid to late April well before the historic rally took hold and while many others were talking doom and crashes. We discussed for weeks in our videos, looking back April 7th “was what we thought was “The Low” for the overall S&P500 index and USA stocks most likely for the rest of 2025, ex the unforecastable Black swan event. The -20% bear market correction was largely event induced by the President’s unforeseen tariff policies.
And investors, the really good news we V-bottomed and this V-bottom happened WITHOUT Federal Reserve intervention and interest rate cutting. More Fed cuts are in front of us. What’s their timing? I’ll let the academics, economists, strategists, and financial commentators in social media discuss that one ad nauseum discussing irrelevant things in my view such as “dot plots and “fed funds futures”. Chris “irrelevant”? how can that be!. Because as I’ve messaged for th better part of 5 years, they have near zero predictive power in detecting the level of future interest rates. Study after study of data says that the Fed is a momentum investor. Cuts beget cuts, and their timing is much less important than most think. Direction first.
Think investors, we are at marginal new ATH’s in stocks, and the Fed is paused. Think about it, all those bear calls for a market collapse as the Fed reduces its balance sheet! Remember those smart calls 2 years ago? Those calls that the stocks market was near perfectly correlated with the Feds balance sheet expansion. Well, we are near 6275 on the cash SP500, as I write this and the Feds balance sheet has shrunk by $2.5 Trillion since they began QT.
Now sitting in July, I have been flooded with bullish pieces written largely from those who missed the near 4 months v-bottom rally, discussing the wonderfully positive seasonal tendency of July to be the second best perfroming month of the year.
I’m here to bring you good news and bads news. First the good news. Investors, we are in a bull market. Against the perma bear calls for immeniant collapse, Jeremy Grantham amongst others for near 15 tears. Against the retired hedge fund billionairre calls for looming debt implosion or championiong the beauty of the Chinese command economy, Ray Dalio, for the last 12 years by my count. And against the most recent calls for an inflationary spiral cuased by tariffs, we are in a bull market. Plain and simple.
If you got scared out or pulled the plug for emotional reasons, it might be time to enlist a professional money manager or at least a financial player such as Oak Harvest to help determine if you are allocated to far over your skiis versus your risk tolerance or against your needs. In simplar terms, let us help you determine a plan that meets your needs first and your greeds second.
If you didn’t get scared out, congratulations. You might be with a good planner, might have a strong self directed plan or maybe you are on a vacation! We are in a bull market. Up and too the right. Breadth has been strong, forget those naysayers who keep tellinh you its only 5-10 stocks in the markets. It’s only NVDA or Netflix or MSFT. They are wrong and have likely been wrong for months if not longer.
The naysayers who keep trying to scare you about interest rates above this level or that level being “key”? Well they’ve been wrong. Interest rates have been in a range and bouncing around. But Chris, interest rates have been so volailte! China is dumping US bonds as is all these other countries I hear about on TV. Possibly, but I’m sorry but the data says otherwise. Bond volailtity has been declining not rising. The best proxy I’ve found for bond vol is the MOVE Index. We’ve talked about this one for years. In fact dscussing it long before most on TV. Why? The MOVE index measures LT Treasury bond volailty. A high or higher trending number=more bond volailty = many market players have to deleverage. They have to sell assets. They have no choice. Their brokers tell them this, US treasuries are the safest collateral in the world but if thir price is moving to fast, you much deleverage. No ifs and or buts. Here’s a chart of the MOVE index.

In this chart, like most things in the bond world, its opposite a stock chart, down and to the right is good, and up and too the right is bad.
The circels are the Fed rate cuts in 2024. Right now the way I see it, the overall trend is lower, which is good, but we are now on support, which is not so good particuallry entering a seasonally weaker time of the year.
This coupled with the likelihood of a small pickup in inflation the next couple of months casuued by the lag effects of the Trump tariffs, should make one slower to put new capital to work. Here are charts of the longer term 10 year inflation BE rate:

And the shorter term, 2- year inflation break even rate.
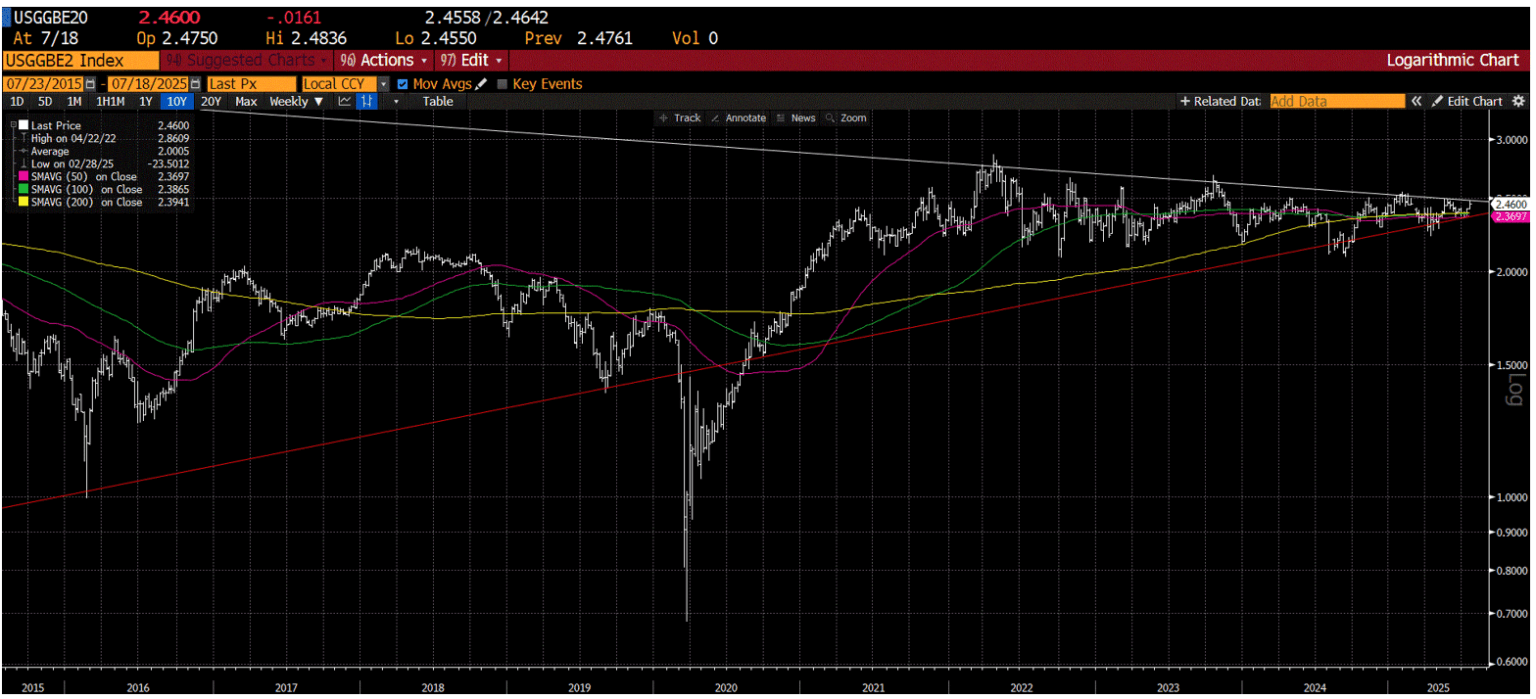
At 2.42-2.45%, neither are horrible, recall, historially speaking 2-3% growth, 2-3% inflation has been goldilocks. Ideally 2-3% growth and 2% inflation would be nicer but we sit a bit higher currently on inflation and lower on growth. I would expect a slight uptick of these inflation figures over the next 3 months on the goods side and many in the higher inflation for longer hysteria camp to hit the media outlets hard in August and September just as stock buybacks slow, inventory has been replentished in front of back to school and Xmas. However, everything I hear and see, there is deflation taking place in the us in the housing and rental markets. Renters I talk to are actually upset about signing leases 1-3 months ago and now seeing the same apaortments for 5-10% less. Homes in the Houston area are sitting on the market longer and regardless of what most agents tell you, the markets are slow and soft for sellers.
Which leads me to the #1 area and likely reason for a very normal summer stall and likely 4-6.5% retracement sometime between mid August and mid October. A further growth slowdown looks to be approaching. Tariff induced. Demand pull forward. Uncertainty uptick. Inventory replenished. At the normal time when there is almost nothing a bullish investor can do to offest a negative story and bearish swirl.
Here’s the real time 2-year Treasury TIPS yield. I call it the real-growth yields. It’s the premium investors demand for holding trreasuries. To mey it’s a measure of growth, not the measure of “treasury risk” that many on TV like to spin it. Investors look at this chart and the last 24 months.
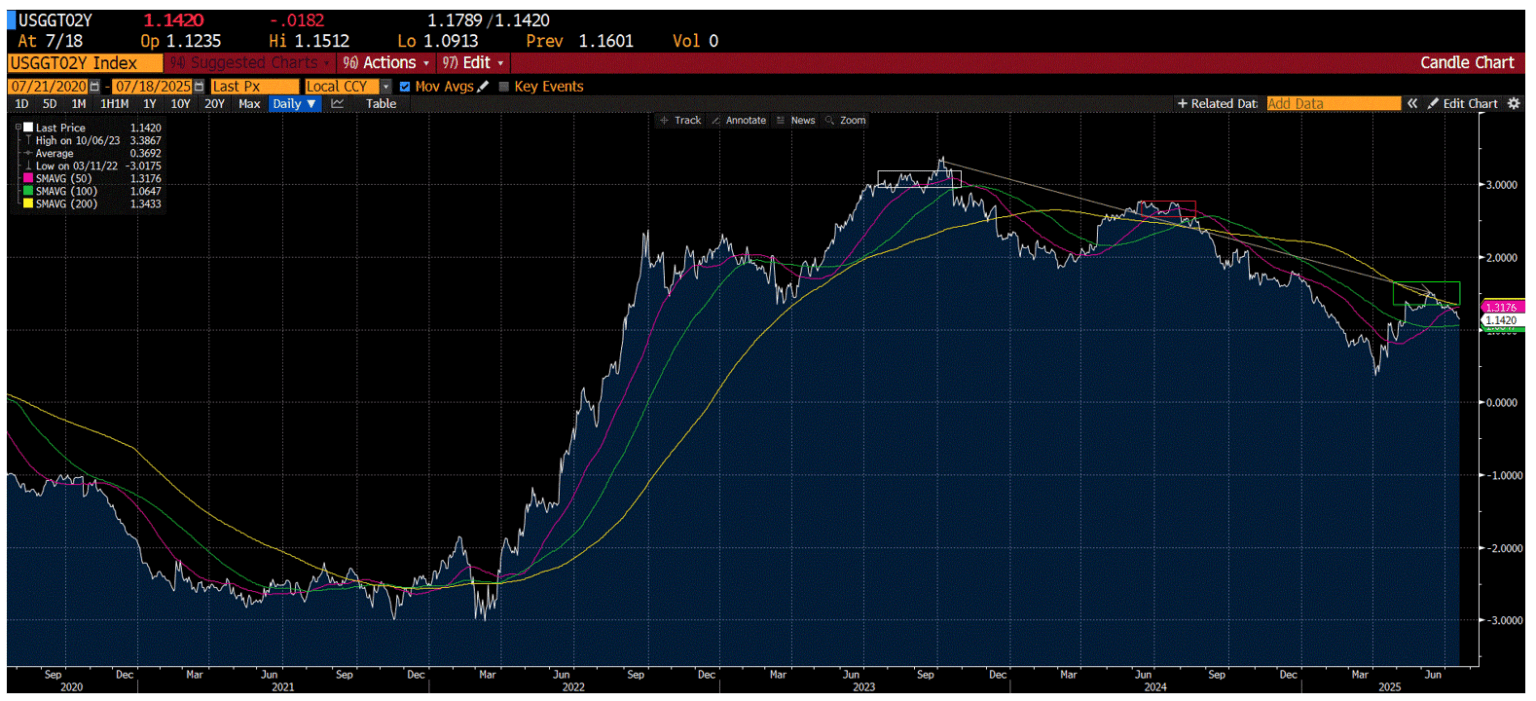
When did real growth peak? It first peaked in mid-2023 which was the confluence of the end of the Covid induenced government give aways and the start of Biden adminstrations call for the IRA spending bill. It then peaked again in ? The summer of 2024 which was? Peak Biden IRA fiscal spendinng in front of the 2024 election. It was relative stable at around 1.75% into year end 2024 post election, until the Trump administration decided frictionary tariffs and trade were their leading issues, not investor friendly taxes and deregulation.
When did it trough? Yes near spot on the first week in April when the adminstration started to walk back its initial draconian tariff game plan. This was one of the real-time data series I was watching that got me confoendt in our V-bottom, no one gets in call back near tax day.
Investors, the problem now? It’s rolling over again. Just as 1- we enter a seasonal weaker time for stocks, 2- investors will have a hard time combatting the demand pull forward talk that should build over the next 4 weeks and 3- the adminstration ramps tariff talk again. I mean really, we neither saw or heard from Peter Navarro on CNBC from April 7th until July 10th?
These are good reasons behind last weeks title. NOTHING but NET. Because historically if you left town after the firs 10 trading days in August and didn’t return until the first 1 or 2 weeks of October you would usually miss nothing net.
Instead of getting FOMO here, how about taking a deep breadth and exhaling and slowing down and think, hmmm if August-early October tend to be stalls at best and down most years, what do I want to wait for to buy on a 3rd quarter slow down? Wehther its caused by an minor uptick in inflation from tariffs? Or A slow down in the real economy due to a pause in demand after a pull forward of inventory building and pull forward buying in front of tarriffs? What stocks and groups would I want to own on the other side of late summer and early fall? Hence “nothing but net” for this weeks title.
We don’t expect a summer squal, but do expect higher levels of investor frustration over the coming 3 months. And yes, even during the Dot.com run in 1998-2000, there was a peroid of about 3 months after the intial 4 month V-bottom post LTCM blowing up, where the overall SP500 churned wothout getting burned. Here’s that update overlay then and now.

Investors, The pattern remains bullish and up and to the right is good. New ATH’s are not bearish historically. However, after rallying for almost 4 months off the April lows, (exactly 4 months is between August 4-8th) do not expect the pace and percentage gains of stocks to continue at this rate. Expect the pace to slow.
Investors we expect a normal late summer pull back in the markets. If this plays out as Our team has stuck with our 2025-yearend target of 6600 even as stocks sold off into April, and most strategists slashed their targets from over this number to the low 5000’s and are now raising them once again.
Does that mean you shouldn’t add to stocks particularly if you are younger and in saving and accumulation mode? No, rarely can you pick the absolute level in both price and time, on both the buy side, sell side, and buy side once again, particularly in growth stocks and as we covered in prior videos.
Regardless of the path for the economy and financial markets in the next few months, the investment team at OHFG will be here manning the ship and adjusting our models and long/short, hedged equity fund where we can.
Until next week, have a blessed weekend, and know that the OHFG team is doing what we can to plan for you and your family’s future regardless of what stage you are at in your career or retirement.
Do you need a retirement plan that goes beyond allocating funds to truly fit your needs? We can help you create a retirement life plan customized for your retirement vision and legacy. Call us at 877-896-0040 or fill out this form for a free consultation: https://click2retire.com/Connect

Chris Perras
CFA®, CLU®, ChFC®
Chief Investment Officer, Financial Advisor
Chris is a seasoned investment professional with over 25 years of experience working with some of the most successful money management firms in the world. Chris has made it a point in his career to adapt as the market landscape changes, seeking to utilize the appropriate investment strategy for a given market environment. His transition from managing billions of dollars at the institutional level to helping individuals and families retire is guided by a desire to see first-hand the impact he is making in the lives of clients at Oak Harvest.
Click to subscribe:


